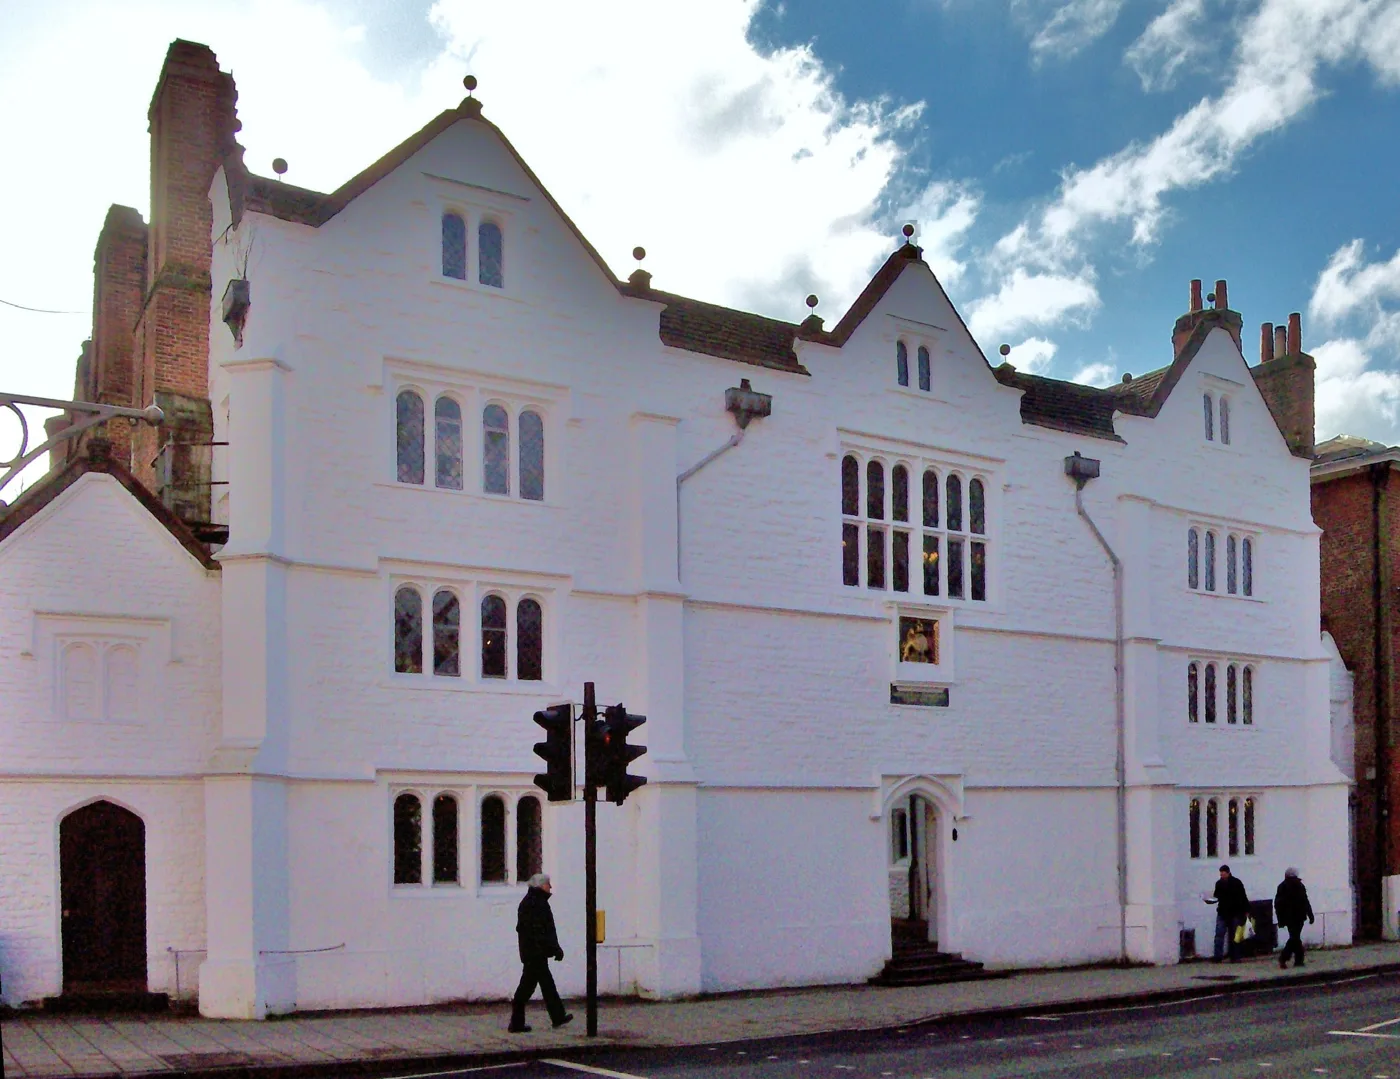

Guildford High awarded 52% of grades at A*, George Abbot 29% at A or above, RGS 33% at A*. Every 2026 figure Guildford's sixth forms have published.
Five Guildford sixth forms put their own A level results on their websites on Thursday, three of them with a full grade breakdown. Here is every figure each school has published, what the national data says about them, and, if the grades were not what a household in Guildford was hoping for, what can actually be done about it this week.
What each school published
Guildford High School reported the highest grade profile of any Guildford school so far: 52% of all grades awarded were A*, and 82% were A*-A. The school also said 22 students are heading to Oxbridge, and that its medicine and veterinary science applicants all secured their places (Guildford High School). Mrs Laurie, Head of Guildford High School, said she was “delighted by today’s results and so proud of each and every student who has worked tirelessly to achieve them”.
RGS Guildford published its headmaster’s comment rather than a full grade table. Across all subjects, 33% of all grades were A*, the cohort secured 315 A* and A grades, 72 students achieved a clean sweep of A or A* grades and 20 students achieved three or more A* grades. On destinations, the school said 98% of places already confirmed are to Russell Group or Times Top 20 universities, with Bath, Cambridge, Durham, Exeter, Edinburgh, Imperial, Nottingham, Oxford and Warwick the most popular (RGS Guildford). Those numbers sit a little below the ones on the school’s own results page for 2025, which record 36% of grades at A*, 358 A* and A grades and 73 clean sweeps.
George Abbot School in Burpham reported that 29% of A level grades were A* or A, 59% were A*-B and 80% were C or above across its A level and BTEC students (George Abbot School).
Guildford County School said this year’s results are the best at A level in the school’s history. It did not publish a grade percentage, but did report that 88% of the cohort applied to university and 44% of those applicants have gained entry to a Russell Group institution, with three Conservatoire and three Oxbridge entrants (Guildford County School). Headteacher Steve Smith said colleagues were “rightly proud of the considerable strengths within this year’s results, while also being keen to look beneath the headline figures”. The school made the same best-in-history claim last summer, when its statement put 40% of grades at A* or A.
Tormead reported 95 A*-A grades in total and singled out its sciences and maths: 100% of Further Mathematics grades at A*/A, and 84% at A*/A in Mathematics and in Chemistry (Tormead School).
St Peter’s Catholic School and Christ’s College had not published 2026 A level figures at the time of writing; both results pages still carried last year’s.
How that compares nationally
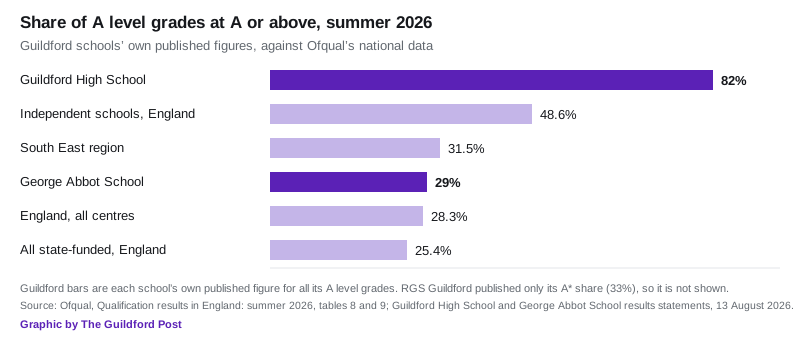
Ofqual published the national picture the same morning. Across England, 835,950 A levels were awarded to 320,505 students at 2,835 schools and colleges, and 28.3% of results were at grade A or above, barely moved from 28.2% last year. 78.1% were at C or above (Ofqual, Qualification results in England: summer 2026).
The South East was the second strongest region at 31.5% at A or above, behind London on 32.7% and ahead of the East of England on 27.9%, from table 8 of Ofqual’s data. Table 9 splits the same results by type of school or college: independent schools averaged 48.6% at A or above, grammar schools 43.4%, all state-funded centres 25.4%, academies 23.5%, local authority maintained comprehensives 23.0% and further education establishments 12.8%.
Read the Guildford figures against the right line and they hold up. George Abbot’s 29% at A or above is above the national average of 28.3% and well above the 25.4% state-funded average, and its 80% at C or above beats England’s 78.1%. Guildford High’s 82% at A*-A is far above the 48.6% independent-school average, and its A* share alone is higher than the whole independent sector’s A-and-above figure.
The new map, and the catch in it
This is the first year Ofqual has broken results down by local authority district. Its map of A level grade outcomes by administrative area lets you pick Guildford, choose a subject and a grade, and compare with any other district in England, with data back to 2019.
One caveat is worth reading before anyone quotes a district ranking at you. Ofqual assigns every grade to an area using the postcode recorded for the exam centre in the National Centre Number register, not where the student lives. A district that happens to contain large selective or independent schools will therefore score highly on the map, and students who live in Guildford but sit their exams elsewhere count towards somewhere else. It is a map of where exams were taken, not of how local children did.
What it means for you
If a place has been missed, or a grade looks wrong, three things matter this week.
Clearing is open until 19 October. It runs from 2 July to 19 October 2026, and it is for anyone not already holding an offer where a course still has places. UCAS’s search tool is the only official vacancy list (UCAS).
A grade challenge goes through the school, not the exam board. Students and parents cannot ask an awarding body to review a result directly. The first step is to speak to the school or college, which can request a clerical check or a review of marking through its exams officer, and needs the student’s permission to do so. An appeal can only follow once that review has produced an outcome, and must be lodged within 30 calendar days of it (Pearson, post-results services).
GCSE results follow on Thursday 20 August, from 9am at Guildford County School and on the same day across the borough (Guildford County School).
One piece of longer-term context: the councils behind local schools are changing. Surrey’s county and borough councils are being replaced by two new unitary authorities in April 2027, with Guildford falling inside West Surrey Council, which will take on education among everything else.
Have your say